UK Trade in Numbers Summary Calendar Year 2018
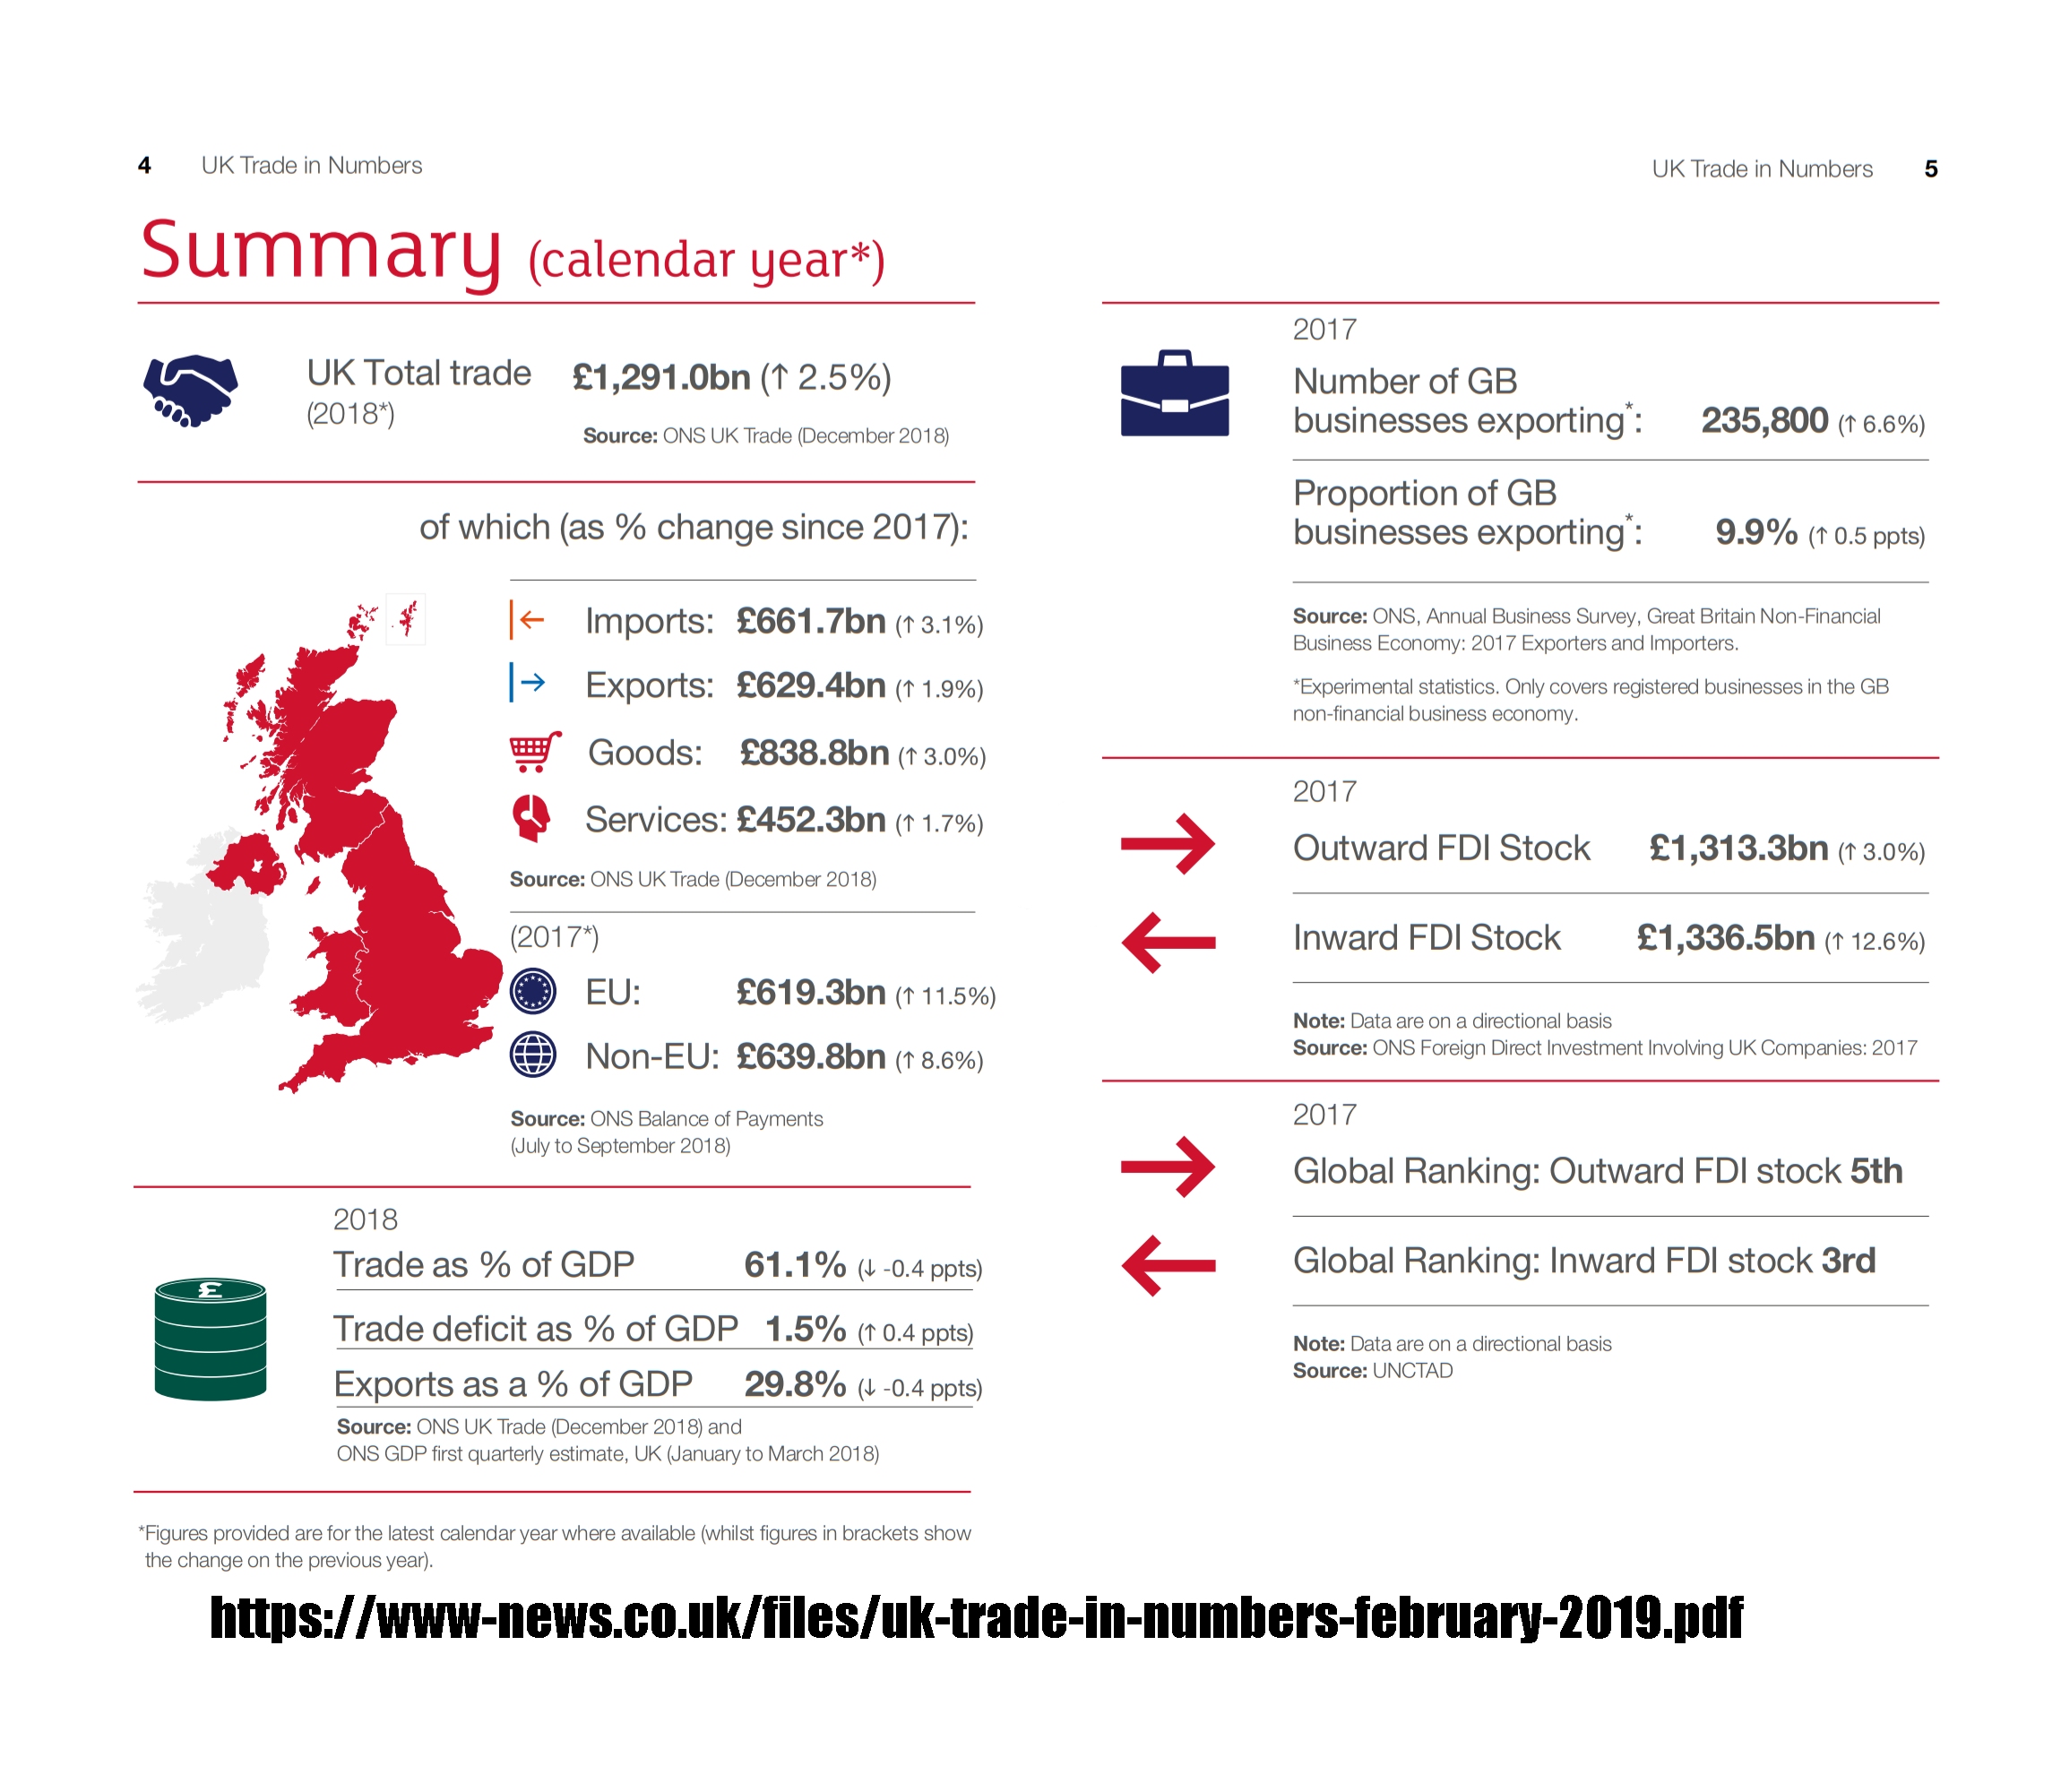
Summary (calendar year*)
UK Total trade (2018*) £1,291.0bn (up 2.5%)
Source: ONS UK Trade (December 2018)
of which (as % change since 2017):
Imports: £661.7bn (up 3.1%)
Exports: £629.4bn (up 1.9%)
Goods: £838.8bn (up 3.0%)
Services: £452.3bn (up 1.7%)
Source: ONS UK Trade (December 2018)
(2017*)
EU: £619.3bn (up 11.5%)
Non-EU: £639.8bn (up 8.6%)
Source: ONS Balance of Payments (July to September 2018)
2018
Trade as % of GDP 61.1% (down -0.4 ppts)
Trade deficit as % of GDP 1.5% (up 0.4 ppts)
Exports as a % of GDP 29.8% (down -0.4 ppts)
Source: ONS UK Trade (December 2018) and ONS GDP first quarterly estimate, UK (January to March 2018)
2017
Number of GB businesses exporting* : 235,800 (up 6.6%)
Proportion of GB businesses exporting* : 9.9% (up 0.5 ppts)
Source: ONS, Annual Business Survey, Great Britain Non-Financial Business Economy: 2017 Exporters and Importers.
*Experimental statistics. Only covers registered businesses in the GB non-financial business economy.
2017
Outward FDI Stock £1,313.3bn (up 3.0%)
Inward FDI Stock £1,336.5bn (up 12.6%)
Note: Data are on a directional basis
Source: ONS Foreign Direct Investment Involving UK Companies: 2017
2017
Global Ranking: Outward FDI stock 5th
Global Ranking: Inward FDI stock 3rd
Note: Data are on a directional basis
Source: UNCTAD
Read Full News Story » UK Trade in Numbers February 2019


